Geotechnical Insights Hub
User Guide
This guide explains how to use the tools on the site and where to find key sections. It walks through the typical workflow: account/project/borehole management, using project data in tools, saving results, viewing plots, and exporting reports.
1. Site and Menu
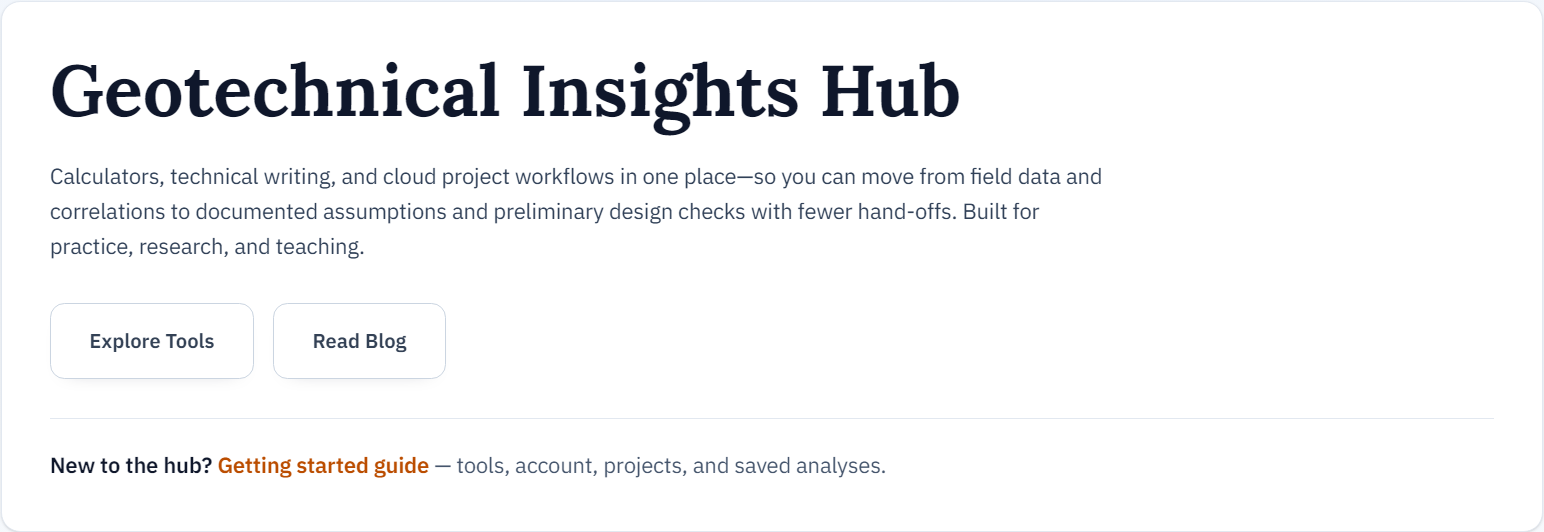
On the home page, use Explore Tools and Read Blog to jump straight to calculators and articles. The Getting started guide link at the bottom gives a short overview of tools, account, projects, saved analyses, and AI-assisted reporting when your plan includes it.
The top navigation lists Home, Tools, Blog, Contact, and Account. Use Account to sign up, sign in, and manage your profile; Contact for messages. The active page is highlighted in the menu.

2. Account: Login and Sign Up
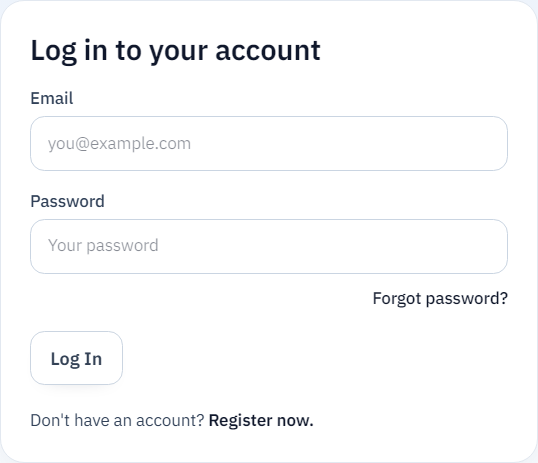
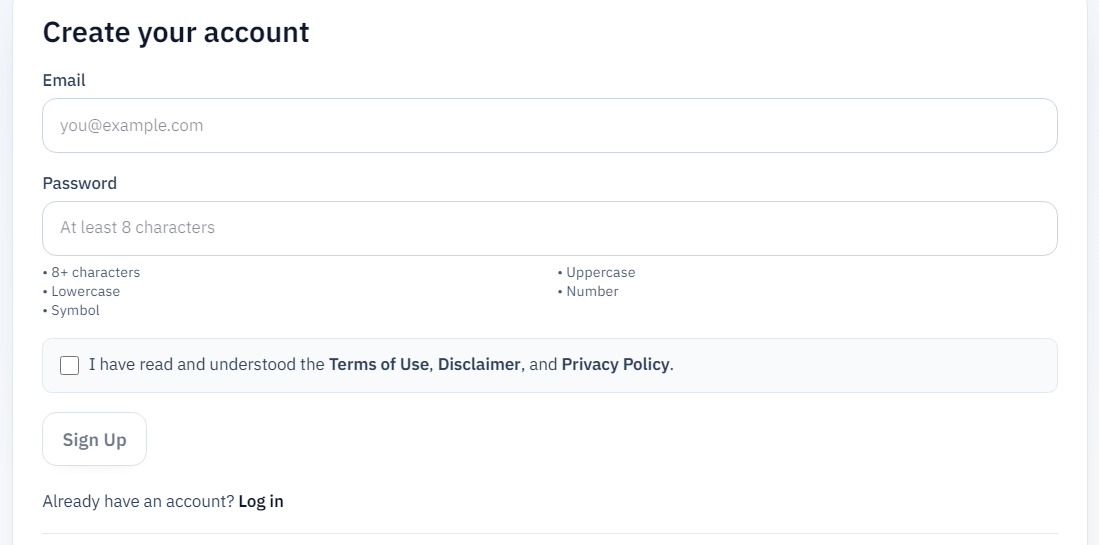
Click Account in the top menu to open /account. Use Log in to your account with email and password, or Forgot password? for a reset. If you are new, choose Register now. to switch to Create your account: meet the password rules, accept the legal terms, then Sign Up.
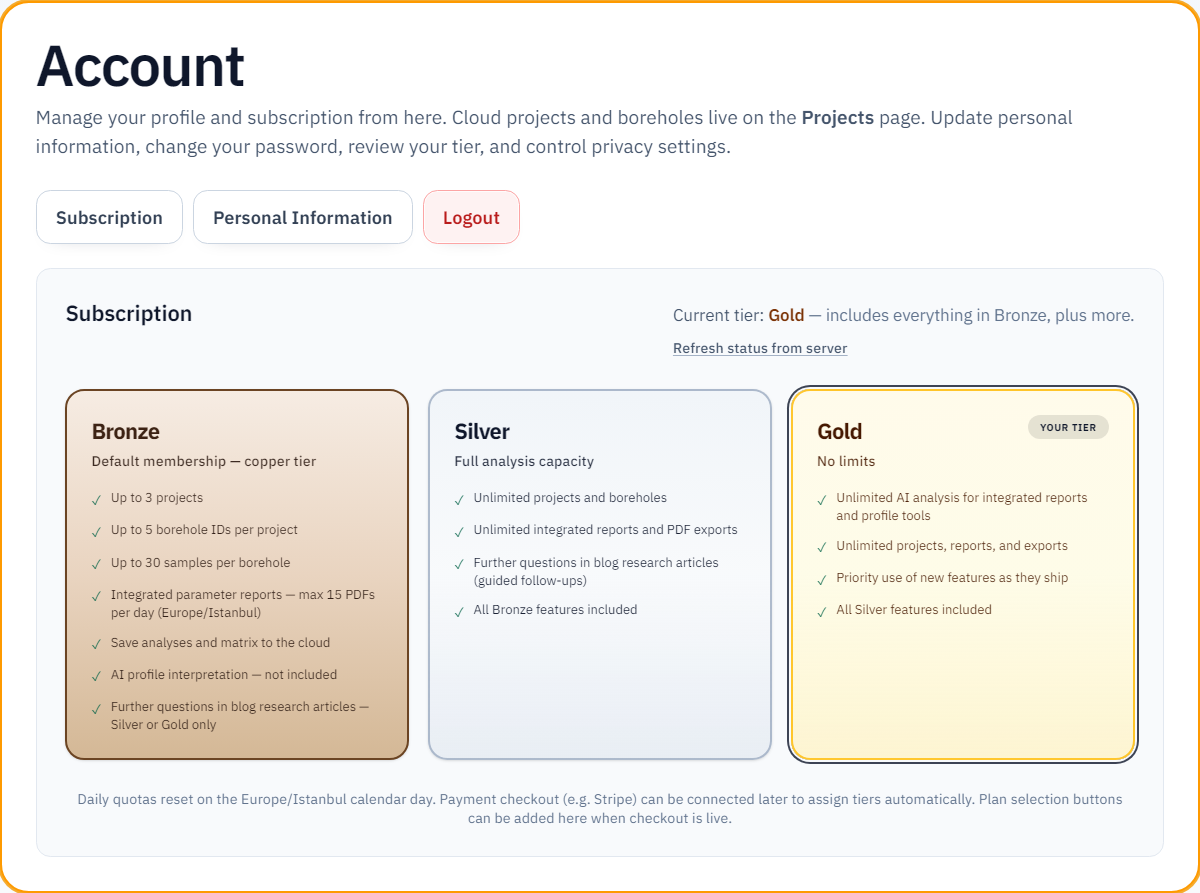
Membership has three tiers: Bronze, Silver, and Gold. Under Compare membership tiers on the sign-up view, plans are shown side by side. New accounts start on Bronze; upgrading unlocks Silver or Gold limits.
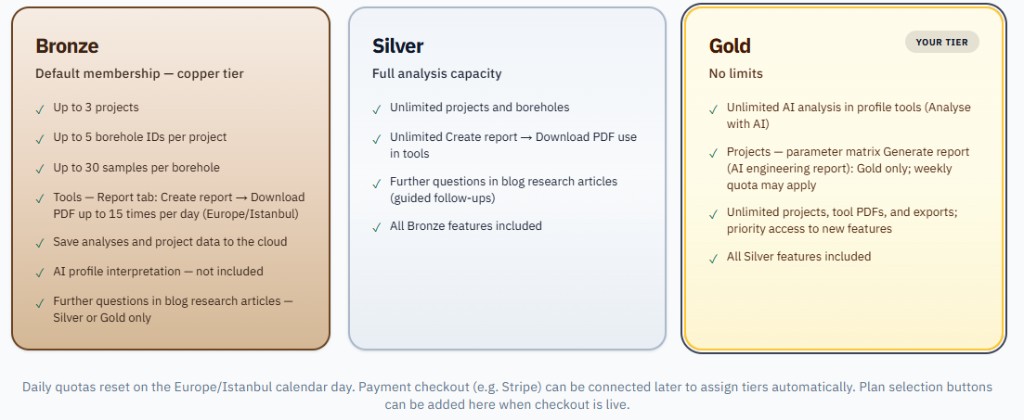
Bronze: All new members start here. Up to 3 projects, 5 borehole IDs per project, 30 samples per borehole. In each tool’s Report tab, completed Create report → Download PDF actions are limited to 15 per calendar day (Europe/Istanbul). Save analyses to the cloud. Analyse with AI in tools is not included. The Projects parameter matrix Generate report (AI engineering report) is Gold only and uses a separate weekly quota—not this daily limit. Further questions in blog research articles are Silver or Gold only.
Silver: Unlimited projects and boreholes; unlimited Create report → Download PDF use in tools. Parameter matrix Generate report (AI) is not included — Gold only. Further questions (guided follow-ups) in blog research articles. All Bronze features are included.
Gold: Unlimited AI analysis in profile tools (Analyse with AI). On Projects, parameter matrix Generate report (AI engineering report) is included for Gold with a weekly allowance that may be shown. Unlimited projects and tool PDFs in practice; priority access to new features. All Silver features are included.
Note: You can browse tools and the blog without signing in; cloud projects, saved analyses, and membership quotas require an account.
3. Account: Information and Subscription
After you sign in, your account unlocks features based on your membership tier. The Account control in the top menu uses tier colours (Bronze, Silver, or Gold); when signed in it also shows a small green checkmark. The Projects link appears next to Account.
On /account, the information card border uses the same tier palette. You get Subscription (current plan and comparison), Personal Information (email display and password change), and Logout.

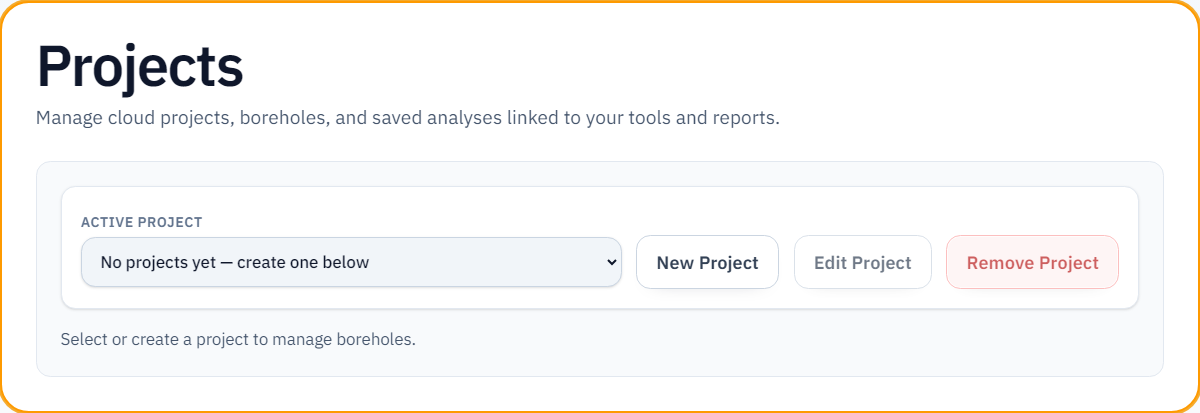
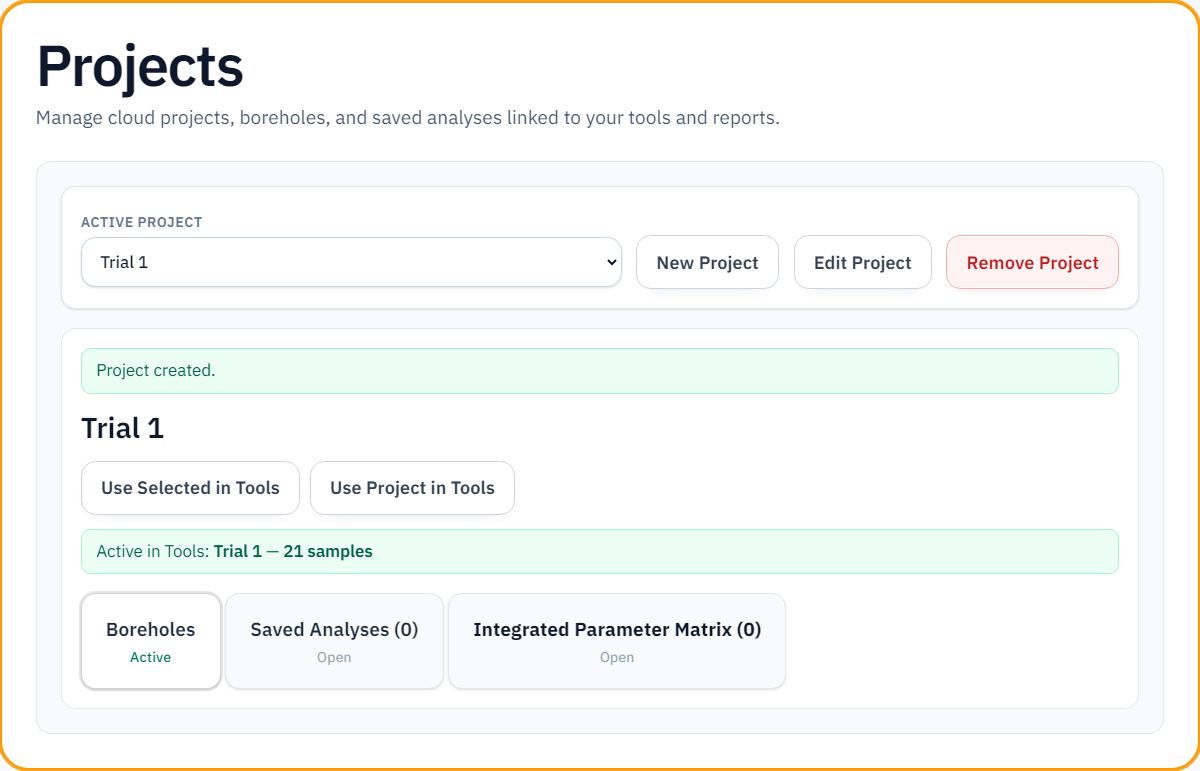
4. Project: Add and Edit
After you sign in, the Projects link appears in the top menu. /projects is where you create, select, edit, or remove cloud projects—the main hub for project management. Depending on your plan you can have up to 3 projects; when the limit is reached, creating new projects is disabled.
Each project includes Boreholes, Saved analyses, and a parameter matrix card (on-screen title: Integrated Parameter Matrix)—open the cards to work with borehole data, saved tool runs, and the merged parameter table.
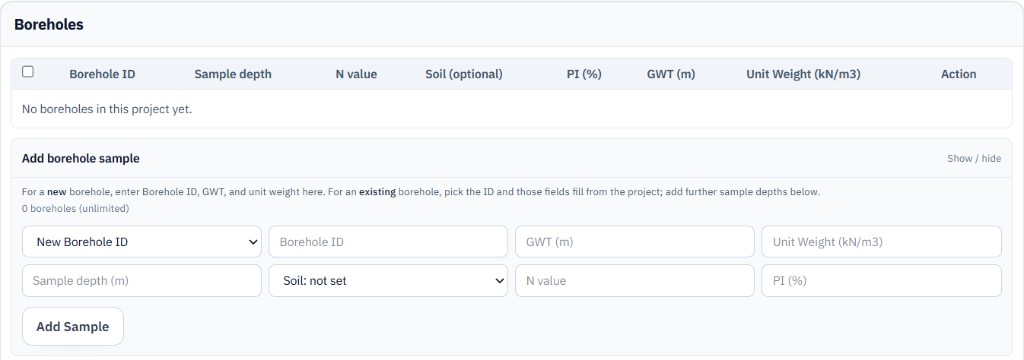
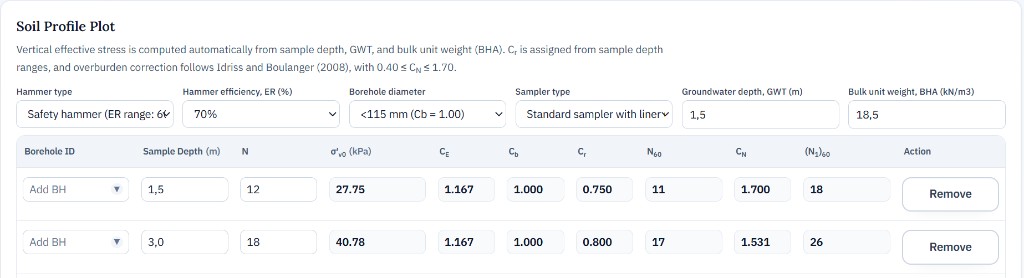
5. Boreholes: Add and Edit
Under each project, open Boreholes to define boreholes and enter their key data (ID, GWT, unit weight, and sample rows). When you add another sample under an existing borehole ID, saved fields for that borehole load from the project automatically—you mainly enter the new sample-specific values (depth, N, PI, and so on).
In the Add borehole sample section, New Borehole ID defines a new borehole name; Existing Borehole ID adds another sample depth under the same borehole. Sample depth, GWT, unit weight, soil behaviour and N values are stored here. Once you reach 5 distinct borehole IDs per project, you can only add samples to existing IDs.
On tool pages (/tools/…), open Projects and Boreholes in the header, pick your project and boreholes, then click Use in Tools—samples are pushed into the tool’s profile rows automatically. Click Clear to detach project data and switch back to manual entry inside the tool.
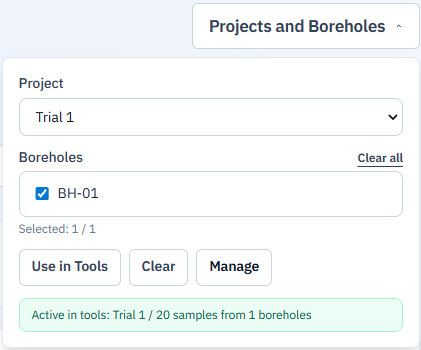
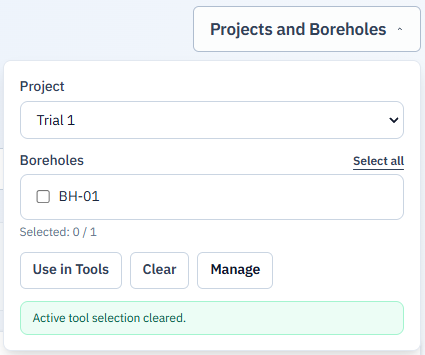
Left: samples active in tools after Use in Tools. Right: selection cleared with Clear—switch to manual input.
Using tools with/without project data
Without project data: You can fill numeric fields directly without signing in or selecting a project in the header; results are still computed. In profile tools you enter rows manually—if no project is selected, values are not linked to a project and nothing is auto-imported. Path: /tools → any tool (manual).
With project data: Select a project and boreholes from the header. In profile tools, each row can be matched to your project data via borehole ID and sample depth. Soil behaviour stored under Projects may affect whether a row is eligible in some tools (restricted rows may appear disabled).
6. Use of Tools
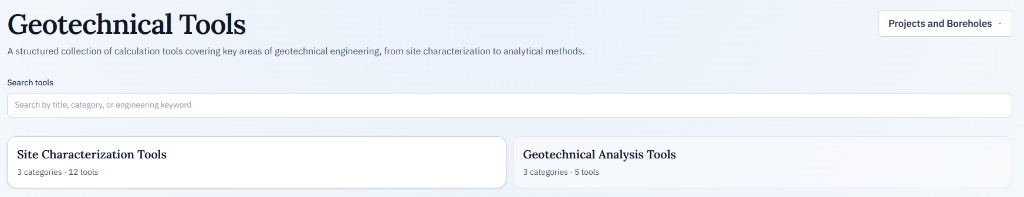
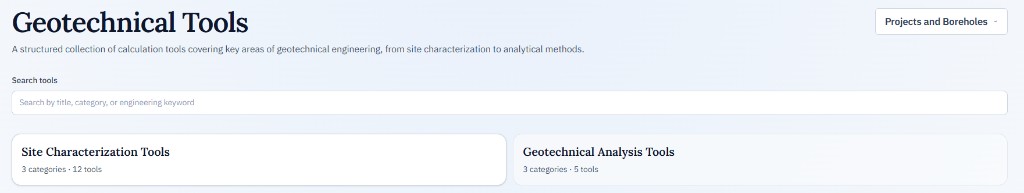
Tools available on the site are grouped into two main categories: Site Characterisation Tools and Geotechnical Analysis Tools. In the screenshot below, each group is highlighted on its card at the bottom of the page.
Each tool has four tabs in the header strip. The screenshot below shows a typical tab bar, followed by a short description of each tab.
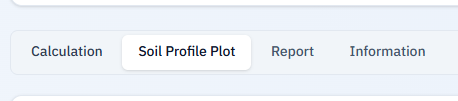
- Calculation — Numeric inputs and on-the-fly computation: enter the relevant parameters and the tool evaluates the defined equations and shows the result (and intermediate values where applicable). This is the quick “calculator” workflow.
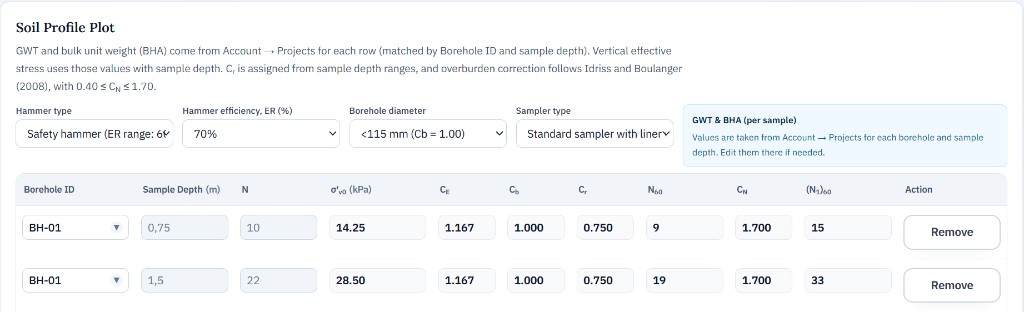
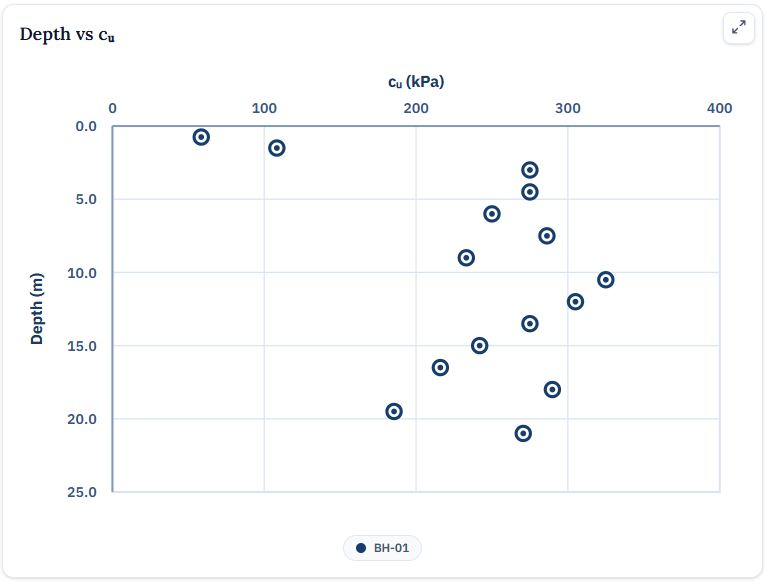
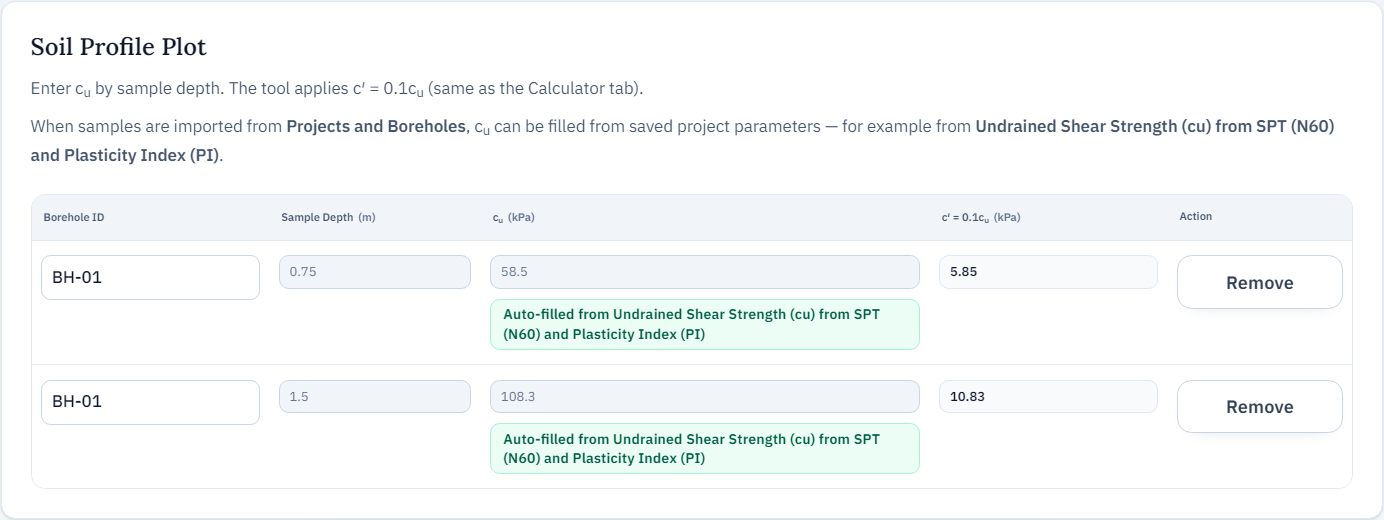
- Soil Profile Plot — Works with sample rows (manual or from the project) along depth / profile axes, computes parameters for the soil model, and plots the outcome. This is the main profile and chart view.
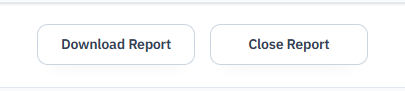
- Report — Build or export a report from calculated samples and tool outputs (e.g. printable summary). You choose which rows and results to include.
- Information — Read-only reference: notation, assumptions, equations used in the tool, and academic / standard citations.
7. Reports
The Report tab provides a detailed template for each tool. Create report includes literature-based introductions and commentary, plus relevant equations and figures; the parameter table and Soil Profile Plot from your inputs are embedded automatically. Academic references at the end follow Harvard-style citations.
Bronze: each completed Create report → Download PDF from this tab counts toward a daily allowance of up to 15 uses per calendar day (Europe/Istanbul). Silver and Gold have no daily cap on that. The Projects parameter matrix Generate report (AI engineering report) is Gold only and does not use this daily allowance.
For Gold members, Analyse with AI runs a tested engineering prompt to interpret the data and show a concise on-page summary.
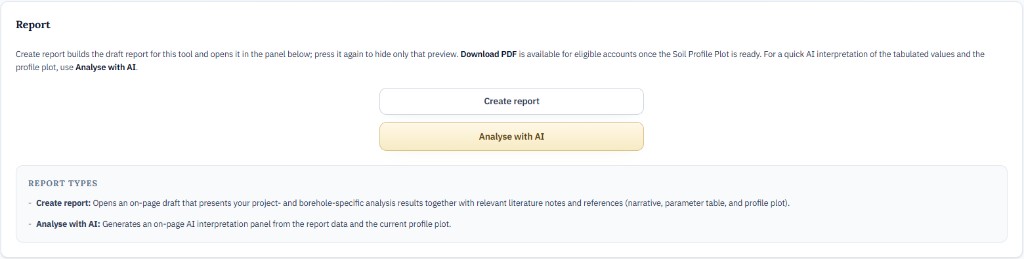
The report layout is designed for PDF download.
8. Plots and Analysis Save
After each tool runs its calculations, it draws depth-based plots—typically on the Soil Profile Plot tab. These charts are among the first outputs reviewed in AI-assisted interpretation.
Profile tools also include a Save Profile Analysis / Save Analysis to Project control. It writes the current analysis into the project folder—input tables and plot images—so you can reopen and restore the work later. You must be signed in with an active project.
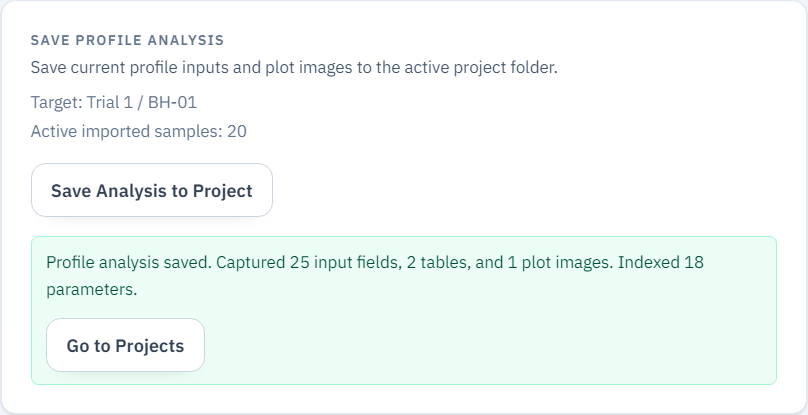
Important note! After Save Analysis to Project, an output from one tool can feed another tool’s inputs automatically (for example, the cu used as an input for the c′ calculation is pulled from results computed in Undrained Shear Strength (cu) from SPT (N60) and Plasticity Index (PI)).
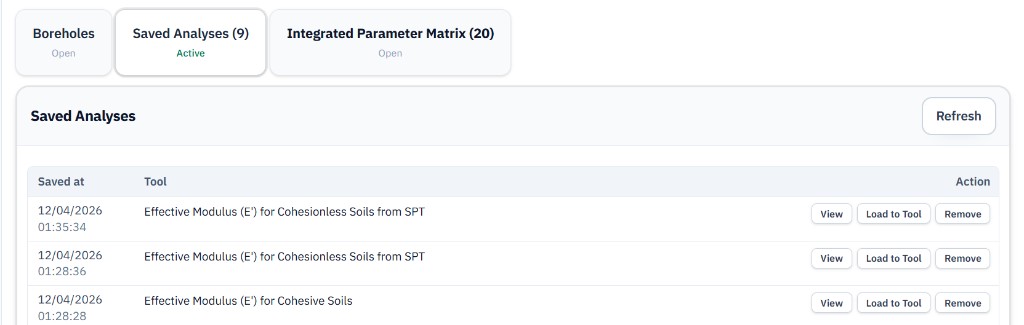
9. Viewing Saved Analysis
To review saved analyses, open your active project from the Projects (account) area and go to the Saved analyses tab. Each row shows the save date and time. Use View to inspect the plot for that run, Load to Tool to reopen the analysis in the originating tool, and Remove to delete the record.
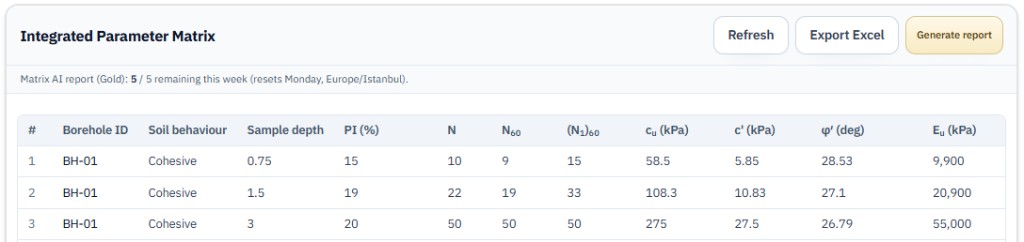
10. Parameter matrix (Projects)
This screen (title on the app: Integrated Parameter Matrix) shows parameters merged from tool analyses saved to the project with borehole samples. Refresh and Export Excel are available where your plan allows. The gold Generate report button is Gold only: it runs a long AI prompt to produce an engineering report and may show a weekly allowance line. This is separate from the daily Create report → Download PDF limit in tools.
11. FAQ
Below are short answers to common “how do I…” questions. Paths are shown with the on-site English control names.
- How do I create a new project?
- Sign in → open Projects from the top bar → on /projects use New Project under Active Project, name the project, and save. If you have reached your project limit, creating a new project is disabled.
- Where do I click to log in?
- Use Account in the top bar → on /account open Log in to your account and enter email and password. Use Forgot password? if you need a reset.
- How do I attach project / borehole data on a tool page?
- On a tool page (/tools/…), open Projects and Boreholes in the header, select your project and boreholes, then click Use in Tools. Use Clear to detach project data.
- Where do I find saved analyses?
- Open Projects → choose your project → the Saved analyses tab. Each row offers View, Load to Tool, and Remove.
- How do I open the parameter matrix?
- Go to Projects → select your project → open the parameter matrix card (on-screen title: Integrated Parameter Matrix). The table merges parameters from analyses saved to that project.
- Where is the report preview and PDF download in a tool?
- Open the Report tab in the tool → Create report opens the draft preview. Download PDF is available for eligible accounts when Soil Profile Plot is ready; on Bronze, downloads count toward a daily allowance (separate from Projects → parameter matrix Generate report).
- How do I add a new sample row to a borehole?
- Under Projects → Boreholes, use Add borehole sample: New Borehole ID creates a new borehole name; Existing Borehole ID adds another depth under the same borehole.
- How do I download this user guide as a PDF?
- Use your browser’s Print dialog (Ctrl+P) → Save as PDF / Microsoft Print to PDF to save this guide as a multi-page PDF.